I think the MJ comparisons are a little extreme and cliche at this point, but there’s no doubt Anthony Edwards is one of the most exciting players in the NBA, and the Timberwolves defense is a force of nature that might just be good enough to beat Jokic over a series.
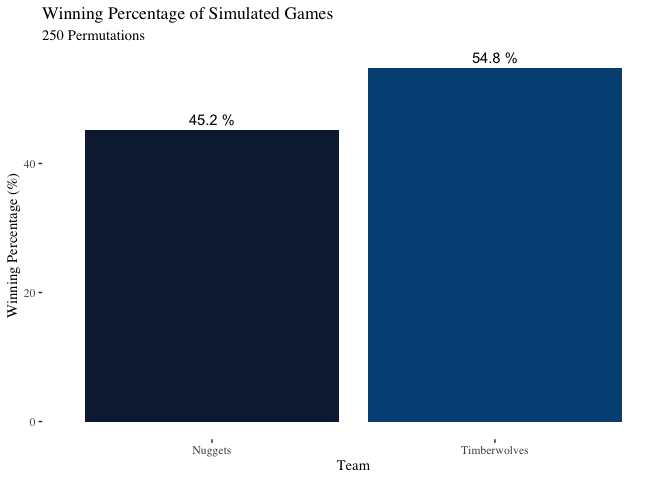
I thought it would it be interesting to “simulate” game 7 250 times by
resampling from scores in each’s team’s regular season in R (shout out
to the NBAloveR package for the functions I used to load the data). I
know it’s a rather crude and flawed method, but the sample sizes are at
least big enough to potentially be interesting/useful. Also, I’d argue
that the data being noisy is actually ok for us because we don’t know
which Minnesota team is going to show up, which Towns shows up.
How many points will the TimberWolves allow?
mean(result$opponent_points)
[1] 110.252
And the standard deviation of how many points the Timberwolves give up:
sd(result$opponent_points)
[1] 9.05896
We’ll see if this prediction ends up being any good… the series has been exciting and back-and-forth so far.
(I’m a Celtics fans so I don’t write about these teams regularly but I’ll have some fun with things)
Who wins?

Thanks for Reading
Go Wolves (for tomorrow night) and go Celtics!
Feel free to leave a comment if you have any questions about how I’m doing this!
I would be happy to share more about my code and methodology on request, but I kind of screwed up this time and didn’t make it fully reproducible.