Shiny Apps
Posit's Shiny package was my introduction to web development. It enables you to easily turn R code into interactive web applications.
Here are a couple of my apps that you can try today:
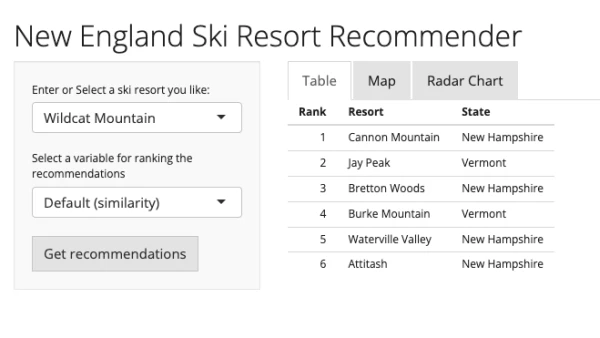
pick a ski resort that you like, get recommendations (using a k-means clustering model)
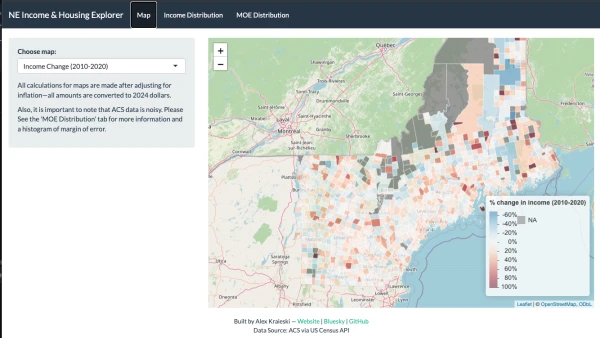
Web maps with 'Leaflet' and ggplot2 to visualize how ACS data has changed over 10 years for household income and home value in New Hampshire, Vermont, and Maine. The data displayed is at the "county subdivision" level, aka what we calls "towns" or cities in New England.
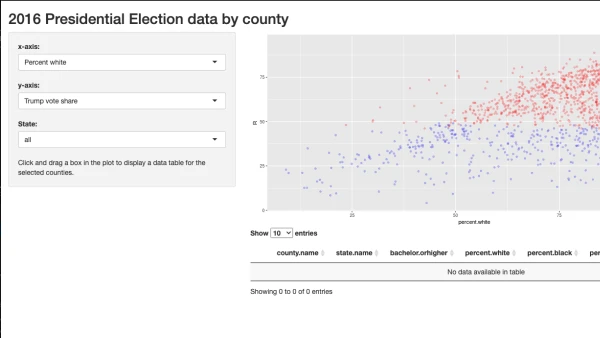
I made this app to plot a dataset that combined ACS (American Community Survey) data with county-level data about voting in the 2016 presidential election. This was probably my first app to start exploring the political and socioeconomic make up of American communities