For me, building my website has always been driven largely by a motivation to share data visualizations made with R. I have had the ability to share articles featuring charts that I author in RStudio or Observable notebooks. I also have had a page where you can see screenshots (w/links) of some of my Shiny apps. But until recently, there was a natural need for something enabling a quicker, interactive way to share fun stuff I come across without writing out a full article or Shiny app.
webR, which lets you run the R statistical language in the browser with WebAssembly, emerged as a compelling option, and I started trying to connect it to my CMS (Statamic- built on Laravel). In my initial attempt, I made it so I could store plots and generate a separate page for each plot. However, because of the slow startup time for webR (we have to be honest here), it became clear that I needed to once again go to Livewire 3 to help make an interactive component that could let the user browse through various plots without having to leave the page.
I ended up building a gallery with Livewire that lets you search and scroll through a list of my plots. Not only does it generate the plot that you choose, but it also lets you copy the code and data to clipboard to experiment with locally if you want. And even though it started out as an experiment (and still is one in many ways), I've already seen an ROI in terms of having a new outlet for sharing my curiousity and creativity.
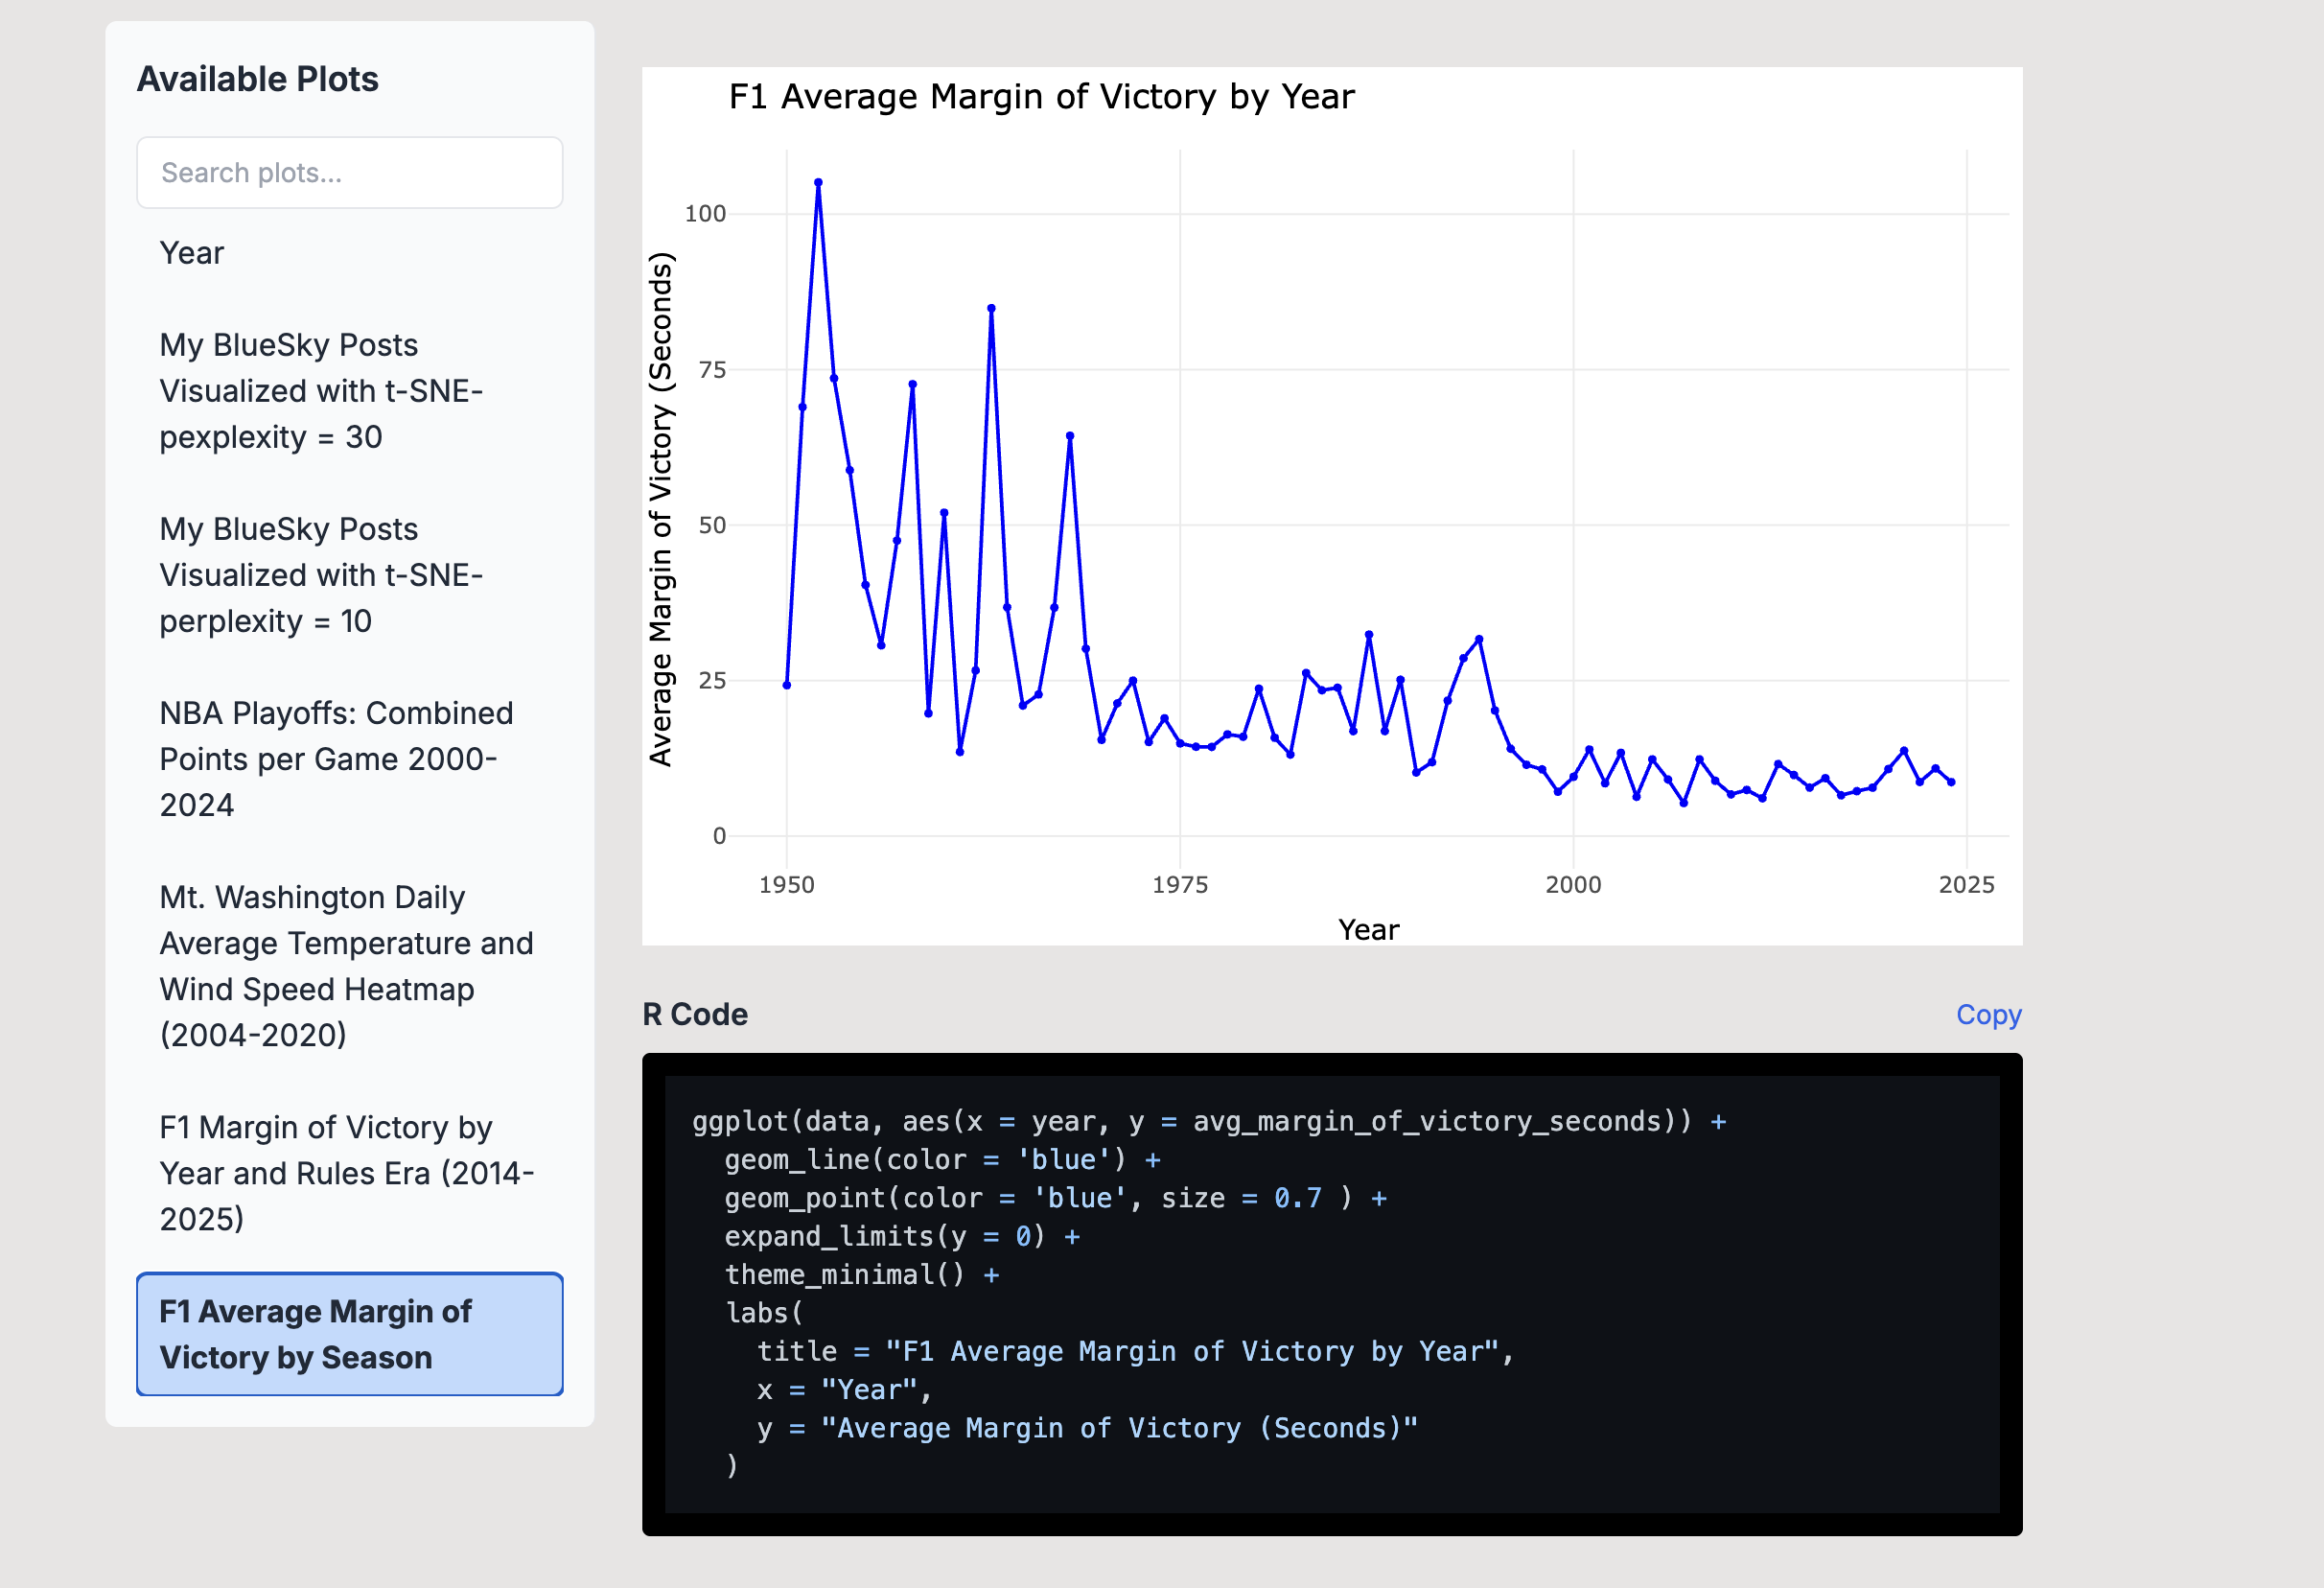 I think the "final product" looks pretty good
If you're a Laravel developer, even if you don't care about R itself, you might find this an interesting case study in integrating JavaScript libraries with Livewire. For example, I've worked with Leaflet.js a lot, and in a Livewire environment, I use the same pattern of dispatching events (which I will use in this article) to update the data in maps.
To begin working on the component, I ran php artisan make:livewire GgplotGallery in my terminal to create 2 files:
- a Blade view,
ggplot-gallery.blade.phpfor the html, which can include Livewire directives (wire:model,wire:click, etc.) and inline scripts - a PHP class,
GgplotGallery.php, that lives on the backend and handles the logic for the component
CMS Setup
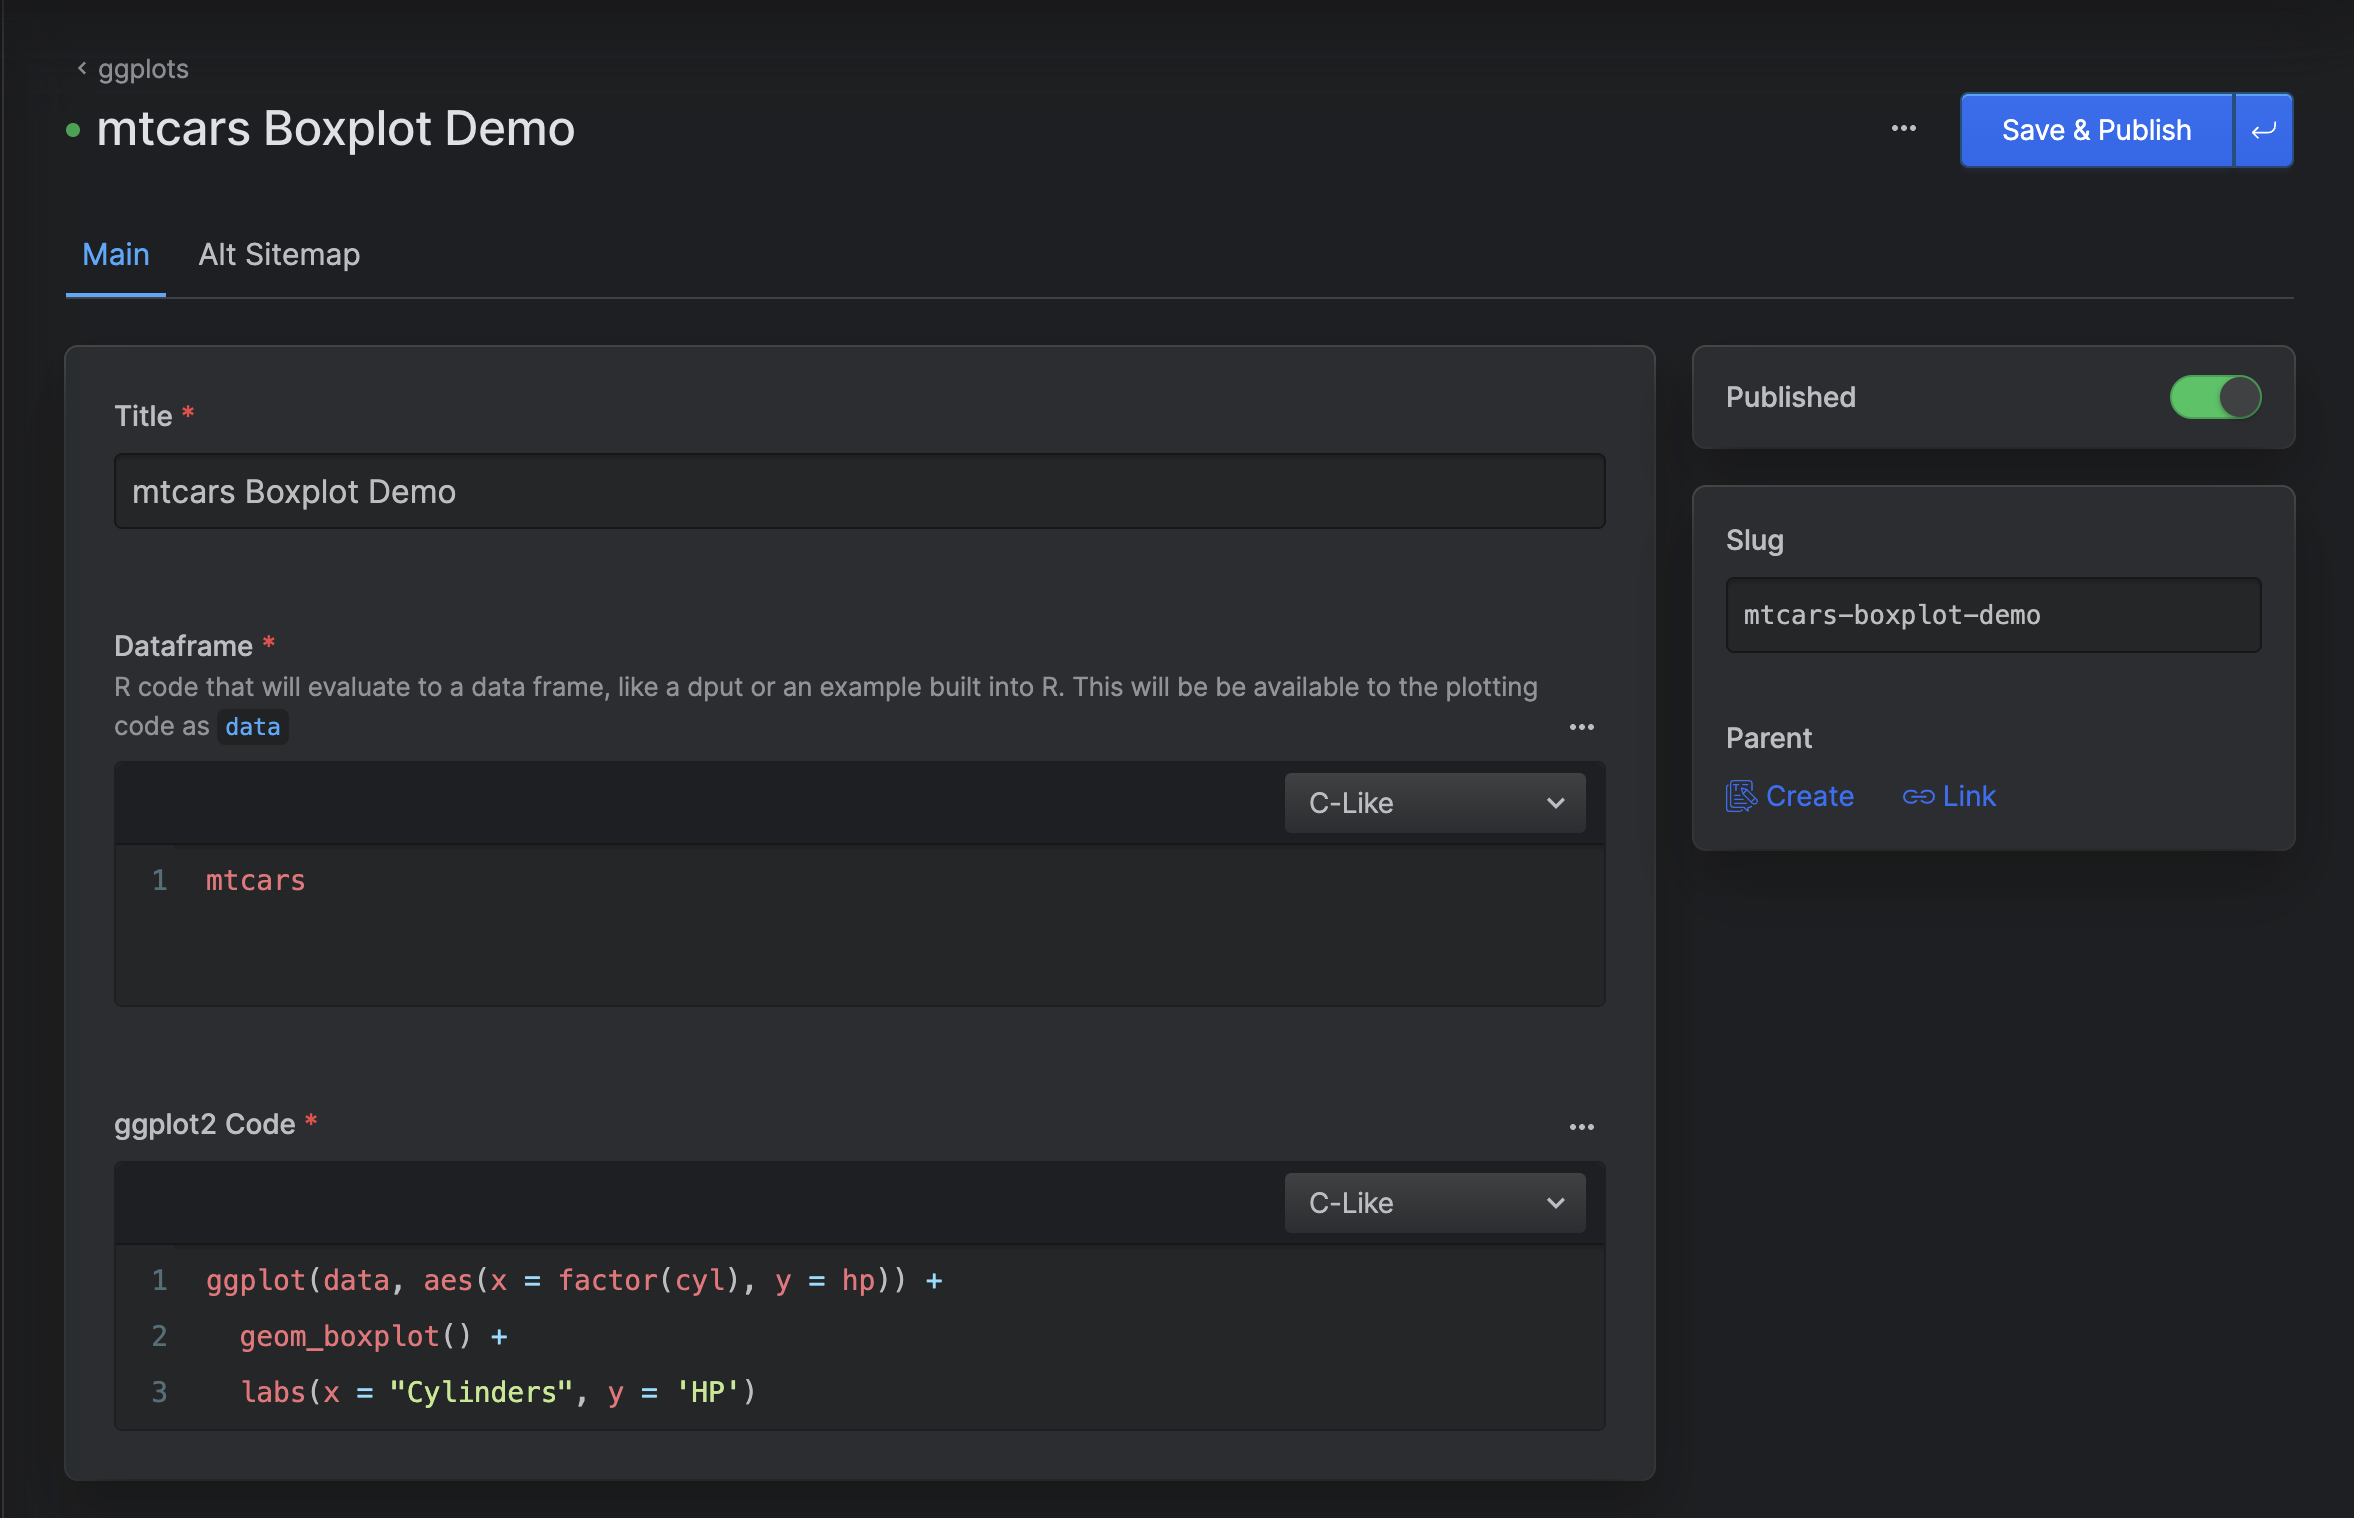
In Statamic, creating a "collection" lets you store entries (either in flat files or a database) on your server. When you create a collection, you configure a field which defines the schema for storing data and the forms for the control panel. For this feature, I set up a ggplots collection with form fields to capture R code for the data (some code that evaluates out to a dataframe) and the ggplot2 code.
Setting up this collection lets us use a query builder later in the backend code to pull the data we need.
So, here is what it looks like when I want to add or edit plots on my site:
Frontend
I started out with a "fully-worked" ggplot2 and plotly example from the webR docs website, and basically the challenge here was to rework it so it could redraw different plots based on events that I would dispatch from the backend.
One modification is that you need to use wire:ignore on the div (or the parent element potentially) that you use as a container for the plot. Other than this, I am going to focus more on the JavaScript part than the HTML and CSS side of things... I don't want this whole article to get too bloated or overwhelming.
In the JS code, keep an eye out for a few things:
- some of the R code (after the
library()calls) to generate the plot is moved to an async function - Because of the way I had to import webR, I can't wrap this script with
@scriptand@endscriptto make Livewire responsible for timing - there is a listener for
plot-changedevents dispatched from the backend to send data for a new plot - I listen for a
livewire:navigatingevent to close webR if the user navigates away with the fake SPA effect that I use on my site (by using thewire:navigatedirective in<a>elements in my navigation). I'm not 100% sure I need to do this, but I definitely did not want R hanging around and hogging someone's resources if they left to read another part of my website - the webR method used to evaluate R code depends on whether we need a value returned to JavaScript and the type of the return value;
WebR.evalRVoid()has no return value, but I useWebR.evalRStringwhen I need to get a string back to JS from R for Plotly. - When importing webR, I am using a specific version instead of latest. This comes from experience. Don't use
latestin prod for something like this.
Now, here is the JavaScript portion of the code adapted for Laravel Blade templating and Livewire events:
<script
        src="https://cdnjs.cloudflare.com/ajax/libs/plotly.js/2.26.2/plotly.min.js"
        charset="utf-8"
    ></script>

    <script type="module">
        import { WebR } from 'https://webr.r-wasm.org/v0.4.2/webr.mjs';

        const outElem = document.getElementById('out');
        const webR = new WebR({ interactive: false });
        await webR.init();

        outElem.innerText = 'Installing R packages...';
        await webR.installPackages(['jsonlite', 'ggplot2', 'plotly'], true);
        await webR.evalRVoid(`library(ggplot2)`);
        await webR.evalRVoid(`library(plotly)`);
        await webR.evalRVoid(`library(jsonlite)`);
        outElem.innerText = 'Rendering initial plot...';

        const initialPlot = {
            dataframe: @js($plotData['dataframe']),
            ggplot2_code: @js($plotData['ggplot2_code']),
        };


        async function renderPlot(plot) {
            try {
                outElem.innerText = 'Generating plot, please wait...';


                const dataCode = `data <- ${plot.dataframe.code}`;
                await webR.evalRVoid(dataCode);

                await webR.evalRVoid(`p <- ${plot.ggplot2_code.code}`);
                const json = await webR.evalRString('plotly_json(p, pretty = FALSE)')

                outElem.innerText = '';
                outElem.replaceChildren();
                Plotly.newPlot(outElem, JSON.parse(json), {autosize: true}, {responsive: true});
            } catch (error) {
                console.error('Plot generation failed:', error);
                outElem.innerText = 'Error generating plot.';
            }
        }

        // Render initial plot
        await renderPlot(initialPlot);

        // Listen for Livewire updates
        Livewire.on('plot-changed', async (plot) => {
            await renderPlot(plot[0]);
        });

        // don't want to leave webR hanging around when the user navigates away
        window.addEventListener('livewire:navigating', () => {
            if (typeof webR !== 'undefined' && typeof webR.close === 'function') {
                webR.close();
                console.log('webR closed');
            }
        });

        window.addEventListener('resize', () => {
            Plotly.Plots.resize(outElem);
        });

        // make sure the highlighting doesn't get messed up when navigating
        document.addEventListener('livewire:navigated', () => {
            document.querySelectorAll('pre code').forEach((block) => {
                block.removeAttribute('data-highlighted');
                hljs.highlightElement(block);
            });
        });
    </script>
If people are interested (let me know in the comments or on social media), I can do a part two where I talk more about and show more of the HTML, Alpine.js, and Tailwind that makes up the UI.
Backend
There are a few things to note here:
- usage of the
#[Url]attribute to sync properties with the browser address bar, in this case, a unique slug - usage of the
#[Locked]attribute to prevent properties from being modified on the frontend. I like using this aggressively to help keep components secure. In Livewire, properties have to be public to be "persisted" between requests, but locking helps us work around this when we don't want something being messed with $plotChangedThisRequestproperty used as a flag to help prevent firing events when not needed. This was something that I had to add as a part of adding the search. You don't want a plot trying to re-render every time the server gets a newly-typed search from the user- I have tried to keep this DRY and organized by extracting out some protected methods, this helps prevent your components from getting too messy as they grow
<?php

namespace App\Livewire;

use Illuminate\Support\Facades\Log;
use Illuminate\Support\Facades\Redis;
use Livewire\Attributes\Locked;
use Livewire\Attributes\Url;
use Livewire\Component;
use Statamic\Query\Builder;
use Statamic\Facades\Entry;

class GgplotGallery extends Component
{
    #[Url(as: 'plot')]
    public ?string $slug = null;

    #[Locked]
    public  $plotData = [];

    #[Locked]
    public array $plots = [];

    public string $search = '';

    protected bool $plotChangedThisRequest = false;

    public function mount()
    {
        $entries = $this->allPlotsQuery()->get();

        $this->plots = $entries->map(fn ($entry) => $this->formatEntry($entry))->toArray();

        if (is_null($this->slug) && count($this->plots) > 0) {
            $this->slug = $this->plots[0]['slug'];
        }

        $this->plotData = $this->getPlotData();
        $this->plotChangedThisRequest = true;
    }

    public function render()
    {
        $plotData = $this->getPlotData();

        if (!is_null($plotData)) {
            if($this->plotChangedThisRequest) {
                $this->plotData = $plotData;
                $this->dispatch('plot-changed', $plotData);
                $this->incrementRequestCount();
            }
        } else {
            abort(404, 'Plot not found');
        }

        return view('livewire.ggplot-gallery');
    }

    public function updatedSearch()
    {
        $this->plots = $this->allPlotsQuery()
            ->where('title', 'like', '%' . $this->search . '%')
            ->get()
            ->map(fn ($entry) => $this->formatEntry($entry))
            ->toArray();

        if (count($this->plots) > 0 && !in_array($this->slug, array_column($this->plots, 'slug'))) {
            $this->slug = $this->plots[0]['slug'];
        }
    }

    public function updatedSlug(): void
    {
        $this->plotChangedThisRequest = true;
    }

    protected function allPlotsQuery(): Builder
    {
        return Entry::query()
            ->where('published', true)
            ->where('collection', 'ggplots')
            ->orderBy('order');
    }

    protected function formatEntry($entry): array
    {
        return [
            'slug' => $entry->slug(),
            'title' => $entry->get('title'),
        ];
    }

    protected function getPlotData(): ?array
    {
        $entry = Entry::query()
            ->where('slug', $this->slug)
          	->where('published', true)
            ->where('collection', 'ggplots')
            ->first();

        if ($entry) {
            return [
                'title' => $entry->get('title'),
                'dataframe' => $entry->get('dataframe'),
                'ggplot2_code' => $entry->get('ggplot2_code'),
            ];
        }

        return null;
    }

    protected function incrementRequestCount()
    {
        try {
            Redis::incr('ggplot_request_count');
        } catch (\Exception $e) {
            Log::error('Failed to increment Redis counter: ' . $e->getMessage());
        }
    }
}
If you want to build a component like this for a normal Laravel site without Statamic, you can make a plots table in your database and then use Eloquent as your query builder instead of the one from Statamic that I used here.
Licensing of Code in this Article
The code snippets in this article are provided under the MIT License. You’re free to use, modify, and distribute them as you see fit, with or without attribution.
The webR binaries are GPL-3, but other software in their repo is distributed under an MIT license.
Room for Improvement
Here are some areas I want to improve (as of the time of writing):
- Accessibility: I think some kind of text description of the plots is necessary, but I need to research what the best thing to do is here
- Caching/optimization: I should probably be caching the full array of ggplot2 examples, but I didn't feel the need to optimize that yet. alternatively, it may make sense to have the list of examples in the sidebar paginated
- Occasional syntax highlighting issues w/
wire:navigate: I've had these kinds of issues elsewhere in my site since I started using wire:navigate to get a "fake SPA" effect for my site. I've tried my best to handle this here, but unfortunately not perfectly. - type safety/explicitness: As I was finishing up this article, I noticed that there's missing return types and other low-hanging fruit with types that I need to fix.
- observability/analytics: right now, I am counting the number of ggplot2 requests that my server responds to, but that doesn't tell me anything about what content here people actually find interesting. I am considering adding some sort of feedback mechanism so people can "like" plots on my site
- Laravel idioms/other: There are probably other ways my code could could be "better", so feel free to let me know your thoughts in the comments or by replying to me in BlueSky thread (I usually post my latest articles there).
Is webR Practical?
I think this is the question on everyone's minds, and something like webR is inherently a tough sell for many people. If you're a web developer or frontend engineer, you probably aren't thrilled about the idea of adding something as heavy as f-ing R to your frontend. And many in the R crowd won't want to deal with HTML, JS, and PHP.
However, I think my example here shows it can be practical to wire webR up to existing systems for data and content. Mobile performance is a big limitation (especially when you are using the Tidyverse vs. base R), but you can certainly pair it with a CMS to make it scalable and fun to publish with R in new ways.
At the end of the day though, R is too heavy to be acceptable as a mainstream web development package where R isn't very specifically called for.
Closing Thoughts
webR can be integrated with Livewire and Alpine using an event-driven architecture. Not only does this provide an alternative to frontend frameworks like Vue and React for building experiences with webR, but it also shows how you can integrate webR with existing backends to add value. In my case, the value add comes through enhanced publishing flexibility and a more interactive website experience.
For Livewire devs, you can use the same pattern to integrate with lots of other JS libraries for charting, maps, etc. This can add a lot of value to your apps (vs. using the same libraries in blade without a Livewire integration).
I think we're still working to build knowledge of best practices for webR in production in the R community, so I may be missing some here. Please let me know if you know if any.
If you are interested in using webR with Statamic or Laravel, please feel to reach out to me. I have some other code that I am willing to open source. I just haven't done so yet because using R in Blade and Antlers templating is kind of a niche thing at best!
I hope you have found this article interesting and informative! Thanks for reading. I apologize for the lengthy sections of code. I invite you to check out the live version of the plot gallery component here on my website. (sorry again for poor mobile performance)