In late 2020, I started building an R package called 'c3plot' that wrapped the C3.js chart library (itself a D3 wrapper) with an S3 interface based on R's generic plot() function and associated methods. Unfortunately, C3.js stopped getting new releases right around the same time, leaving my package high and dry. As much as I believed in my mission of trying to learn more about how the base R plot() methods worked and porting them to a JS/htmlwidgets implementation, I gradually abandoned the project as issues (and even a security issue with version of d3-color it uses) piled up in the upstream JS release. But one night a few weeks ago, I asked myself out of the blue if I could use OpenAI's Codex to do a drama-free migration to a different JS library. It turned out the answer was a resounding yes.
I love how Plotly gives you zooming and tooltips to help explore data further, but I never found it convenient to use for exploratory plots in the RStudio viewer, even with ggplotly(). R's base graphics system, on the other hand, is great for so many quick visual tasks you need to do during data exploration and statistical work, but the output itself isn't interactive. At the time, I was doing a lot of JS-heavy Shiny development at work, so learning how to make my own htmlwidgets seemed like a logical and useful next step.
Largely due to the lack of JS library updates, I never really told anyone about that old package except my boss at the time. But my package has come back alive now as {plotjs}.
Examples
You can install the binary version of the package from R-universe with the R command below, or install from my github repo arkraieski/plotjs:
install.packages('plotjs', repos = c('https://arkraieski.r-universe.dev', 'https://cloud.r-project.org'))
The whole point is to give you a syntax that is familiar to base R users of various plot() methods. One notable change with this new package is that you can set a value for the aria-label of the canvas element containing the plot to help with accessibility. Here's an example of a scatterplot:
library(plotjs)

air <- na.omit(airquality)
plotjs(
  air$Wind, air$Ozone,
  col = "tomato3",
  main = "Ozone vs Wind in New York",
  xlab = "Wind (mph)",
  ylab = "Ozone (ppb)",
  aria.label = "A scatter plot showing the relationship (which appears to be inverse correlation) between wind speed and ozone levels in New York. Each point represents a measurement, with wind speed on the x-axis and ozone levels on the y-axis."
)
One of the new features I added was a donut mode for pie charts (I hate pie charts, but base R does have a `pie()` function that I felt obliged to copy).
jspie(table(mtcars$cyl),
          main = "Number of Cylinders in mtcars",
          donut = TRUE)
How I did it
It was after midnight and my team had lost in March Madness. Perhaps seeing Clemson get smoked in basketball made me thankful for being exposed to R as a student there, but I had a sudden urge to see if Codex could bring my new project back to life. I threw a voice prompt at it, starting with the idea of using Observable Plot:
This is an R package utilizing htmlwidgets that aimed to wrap c3.js with an s3 syntax closely inspired by base R's graphics package. Since that library (c3.js) is obsolete now, I want to migrate this fork over to observable plot. For this first phase, I want there to be no changes to the R code and interface (aside from names and updating docs), but the JS should now use observable plot. plan out this first phase of development on a new package where we migrate to observable plot
While "thinking" and building out a plan, Codex correctly realized that Observable Plot didn't really support a lot of the features I was looking for and asked me if there were any alternatives I wanted to use. Chart.js came to mind because I remember talking to devs that use it at a PHP conference I attended for my day job (yes, I develop in too many languages these days but I love it). It's a relatively mature package that does see updates but not excessive API churn that can be prevalent in the JS world. Also, in contrast to D3-based libraries that render SVGs, Chart.js renders in HTML canvas elements. This has performance benefits on larger datasets, apparently, but also some downsides.
With something like this, it's important to make sure you use plan mode in Codex. In addition to the benefits of having the agent plan out the changes first, it gives you a chance to be clear about the scope and requirements when the model asks questions to help plan (I like how Codex does this better than Claude Code). It lets you explicitly reject it when the model suggests building something as a half-assed prototype. The models and harnesses these days can handle non-toy applications and packages relatively easily in many cases, so skip building the toy stage.
The effect on JavaScript code quality from this agentic migration was a mixed bag, honestly. The new JS code did eliminate some code duplication (since I implemented separate widgets for scatter-like plots, bar charts, and pie charts when I created my old package). However, the new code retained my previous excessive usage of the var keyword to define variables when I should have used const or let (I was unbelievably incompetent 5 years ago apparently). If mutability isn't necessary for code to work, it should be explicitly prevented by using const. This helps improve the readability of code (a reader can quickly see what changes and what doesn't) and can help prevent unintended behavior. Of course, it was pretty easy to take another pass and improve this.
Although I said not to touch the R code, Codex still eliminated my {gplots} dependency for col2hex() (itself a pretty thin wrapper on grDevices::rgb()), which I was ok with. I think this is a hint that Codex takes prompt constraints as suggestions sometimes...
I didn't use an agents.md file to give Codex extra instructions, but that does seem to be required to scale. This task was largely on-rails (I constrained the solution space so the agent couldn't mess up my existing interface in R), but for more open-ended development, specificity is required to get good results. I can quickly take an analysis and have Codex transform it into a highly custom Shiny app or Quarto site, but those projects can get increasingly structurally weird if you take Codex off-road and build a type of project where conventions aren't as strong. For example, with a static site I built, I had Codex rip out Quarto to make a leaner site with htmltools, but then I was puzzled by the convention of where the script to build the site was.
I also learned more about widget sizing in htmlwidgets. In addition to JavaScript resize methods (which I knew about), you can also use htmlwidgets::sizingPolicy() to control how your widget appears in various contexts. My widget actually looked fine in the RStudio viewer, but I needed to override some stuff to make it look good when embedded in websites outside shiny and quarto. For example:
plotjsSizingPolicy <- function(padding = 8, browser.fill = TRUE) {
  htmlwidgets::sizingPolicy(
    padding = padding,
    browser.fill = browser.fill
  )
}
And then that sizing policy is used when the widget is created in R.
Could Claude Code has done this migration too? Probably! Codex is good when something would use up too many tokens in Claude Code, but the scale of building or migrating an htmlwidgets package is something both can handle.
To CRAN or not to CRAN?
That is the question. And I don't think the answer is obvious for new htmlwidgets packages.
CRAN optimizes for stability of a statistical ecosystem, but it's now intertwined with the broad world of JS through packages that build on {shiny} and {htmlwidgets}. R Universe offers a very compelling option for shipping binary packages, so non-CRAN distribution is as hot as ever.
I think the recent hack of the Axios NPM package and sustained DDOSing of Ubuntu services at the end of this week demand that we take software supply chain seriously.
CRAN's curation generally provides a lot of protection to that part of the R ecosystem from supply chain attacks. But minified JS is inherently not meant to be human-readable, so htmlwidgets packages are exposed slightly as a weakspot in the R ecosystem's supply chain (from what I can see). This could probably be solved with some sort of LLM-based scanning methodology, but what would be the cost to do that at CRAN's scale?
If agentic coding is useful for package developers/maintainers, then it will almost surely be good for attackers too.
Frankly, I don't really know what the future of software delivery is going to look like, and you might be mostly lying if you think you do.
All of this being said, Chart.js is a lot more on the stable side of things compared to less-mature JS libraries, so I don't foresee a massive maintenance burden from having to bump the version every once and a while. Honestly though, I am in the middle of trying to move to a new city, so I'm not sure I have the bandwidth to try to ship this to CRAN in the short term, but I fully intend for this to be something I maintain as a high-quality tool!
Long-term data science practice requires this adaptability
R makes it easy to get up and running with your own little worlds of data analysis with pipelines where you'll ingest data from various niches to visualize and model. But eventually, entropy comes into the picture. APIs, scrapeable websites, and R packages themselves all can and do go away, as do JS libraries that your htmlwidgets and custom Shiny apps depend on.
You will run into real issues from tech debt, and your ability to deal with it quickly and robustly allows you continue your analyses.
I've seen some developers claim that "AI doesn't help with maintenance," but I think my experience here is a strong counterexample to that. Sure, certain types of AI-assisted workflows let you generate sloppy code faster than you could extract maintenance, but Codex helped me catch up deferred maintenance almost laughably easily.
Wrapping up
Though many commentators talk about the commodification and devaluation of software due to coding agents, I think my experience shows good interfaces might be more valuable than ever. Implementations can be swapped pretty easily, but interfaces that humans will actually want to use are somewhat rare in the scheme of things.
Even if software generally is commodified, I think software for data exploration is still a relatively good investment because it enables smarter execution in so many arenas.
Heck, I started developing another htmlwidgets package literally at the same time as I'm writing this article. And I think that's the true power of Codex (and Claude Code too): it can act as a background R&D boost to certain ideas before you have the attention to context switch to the implementation. I also used Codex to successfully debug an renv issue with a static site build for me while I continued finishing this paragraph.
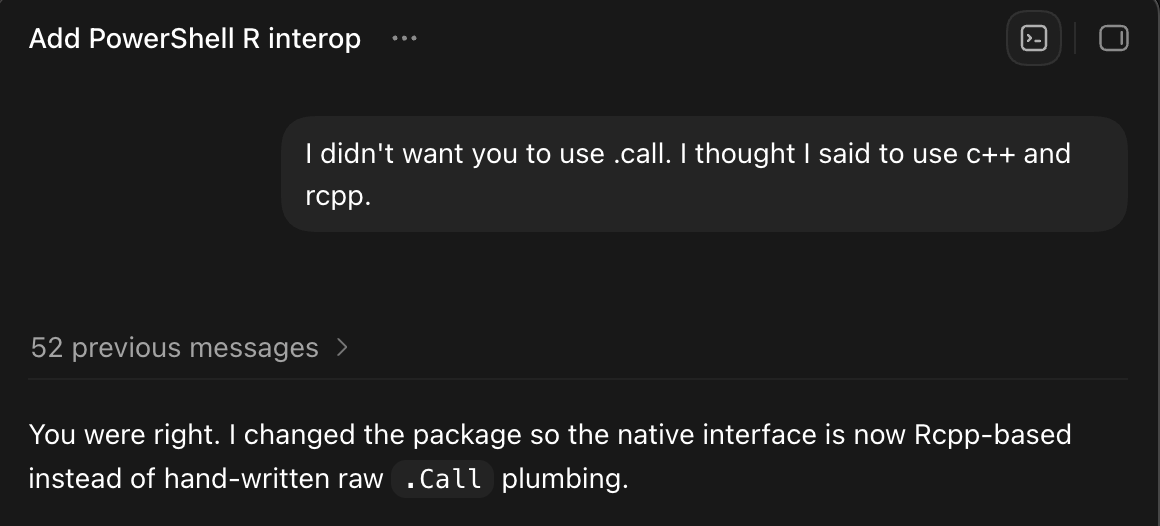
As much as I was impressed with Codex's ability to help me with this migration, I'm not sure how much of my experience would generalize to other languages we use with R like C++ and C where there's a lot that can go wrong with memory management. And sometimes you get weird stuff that is architecturally the opposite of what you asked for, and the answer isn't "prompt better" if it's willing to sometimes do the opposite of your prompts. For example (in a totally different, weird package):
When it isn't directly disobeying you or writing placebo tests, Codex can be a powerful tool, especially if you like test-driven development. I could have done this by hand years ago, but it wasn't fully worth the time and context switching it would have taken.
Although htmlwidgets packages are usually built around a particular JS library, I think my experience here with plotjs shows that they don't necessarily have to be. You can migrate to different JS libraries if your package and interface was initially designed in a way for this to make sense.
Feel free to make your own judgements, but to me, this is the opposite of AI slop. The original R codebase of my package was written while taking a lot of care to read the base R codebase (and often copy-paste sections of it into the new codebase under gpl) and learn about the API design. Reengaging with that endeavor, even with the use of "shortcuts" (which we can reasonably argue are just modern tooling anyway), hardly seems anti-intellectual to me.
The speed at which I was able to execute did allow me to overlook billboard.js (a C3.js successor), but I think I am still very happy with how things turned out and where they are going.
Pay attention to names! That's still the hard part! (along with communication)
If building and maintaining htmlwidgets in R is getting "cheaper" in some ways, then what new data visualization tools would you consider building? I think this is exactly how we have to think right now to keep pushing the boundaries and bringing new software into R.
I think this is an example of tech debt being inflated away until it was cheap to refinance.
Thank you for reading! If you want to learn more about {plotjs}, check out the "getting started" vignette on the package website.